What PcTK can do
How it works
An x-ray photon interacts with photon counting detectors (PCDs) via various phenomena and generates an electron charge cloud or multiple clouds.
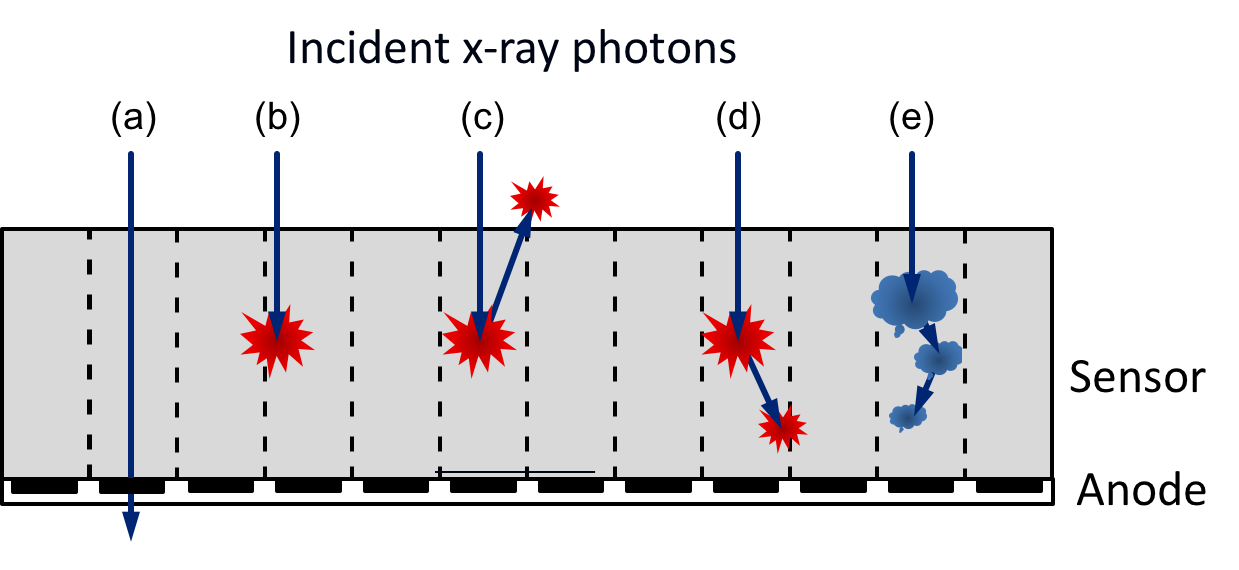
The clouds may be detected by two or more adjacent PCD pixels and the recorded energy may be lower than the original energy due to charge sharing (Fig. 1b), escape and reabsorption of a K-shell fluorescence x-ray (Figs. 1c–1d), etc. This is called double-counting or n-tuple-counting. As a result, PCD data are spatially and energetically correlated. The Photon Counting Toolkit (PcTK) models the x-ray spectrum of recorded PCD data, with such correlation.
PcTK output
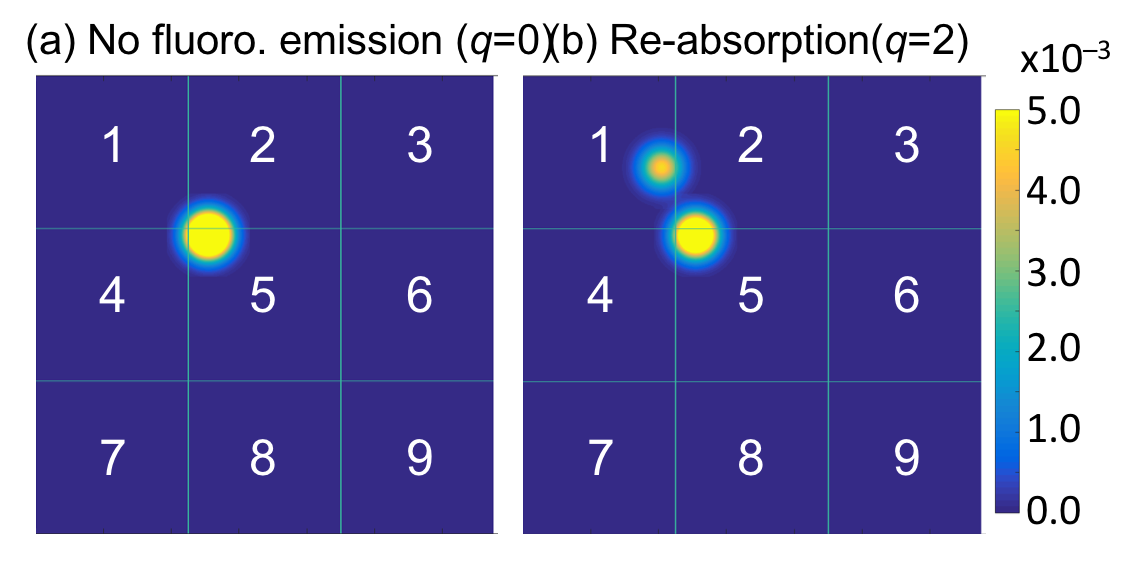
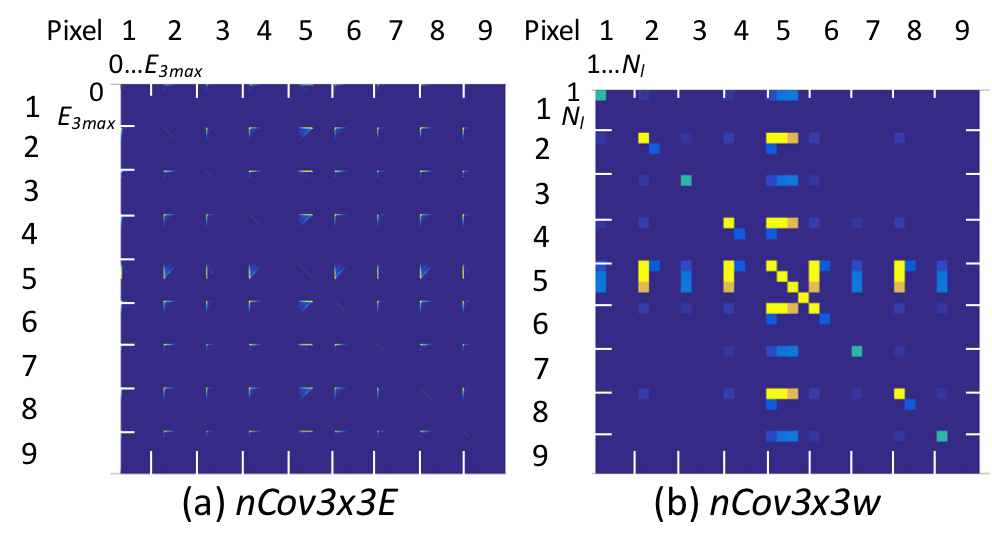
Users define parameters for PCDs such as the pixel size, the pixel depth, the reference size of electron charges, the electronic noise, etc. PcTK then calculates probabilities of the recorded energy and count at neighboring 3×3 PCD pixels when x-rays are incident onto the center of the pixels (pixel 5 in Fig. 2) and outputs a normalized covariance matrix for 1-keV-width energy windows or a given energy windows. It will take minutes or hours, depending on parameters.
Use cases
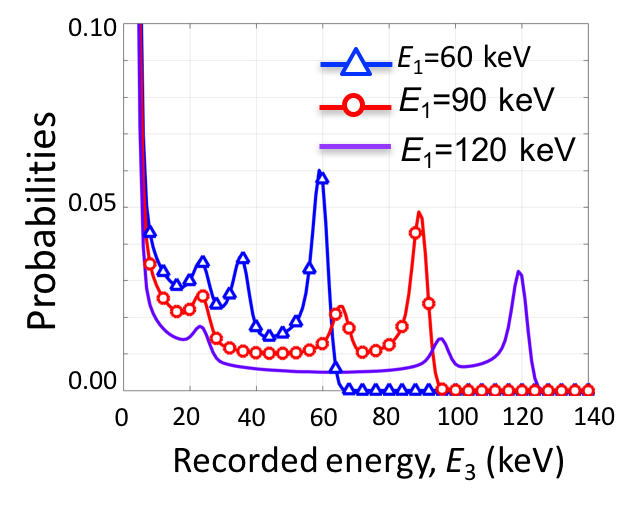
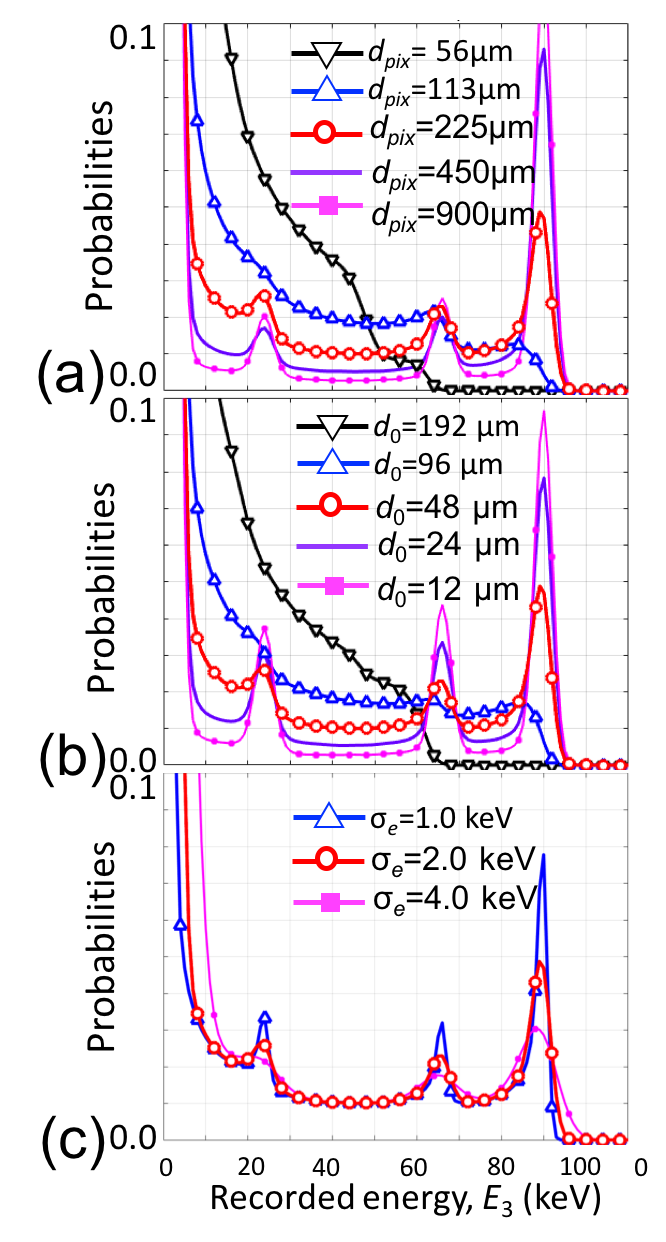
From the output of PcTK, users can generate the recorded spectra as shown in Figs. 4–6. This process is very fast.
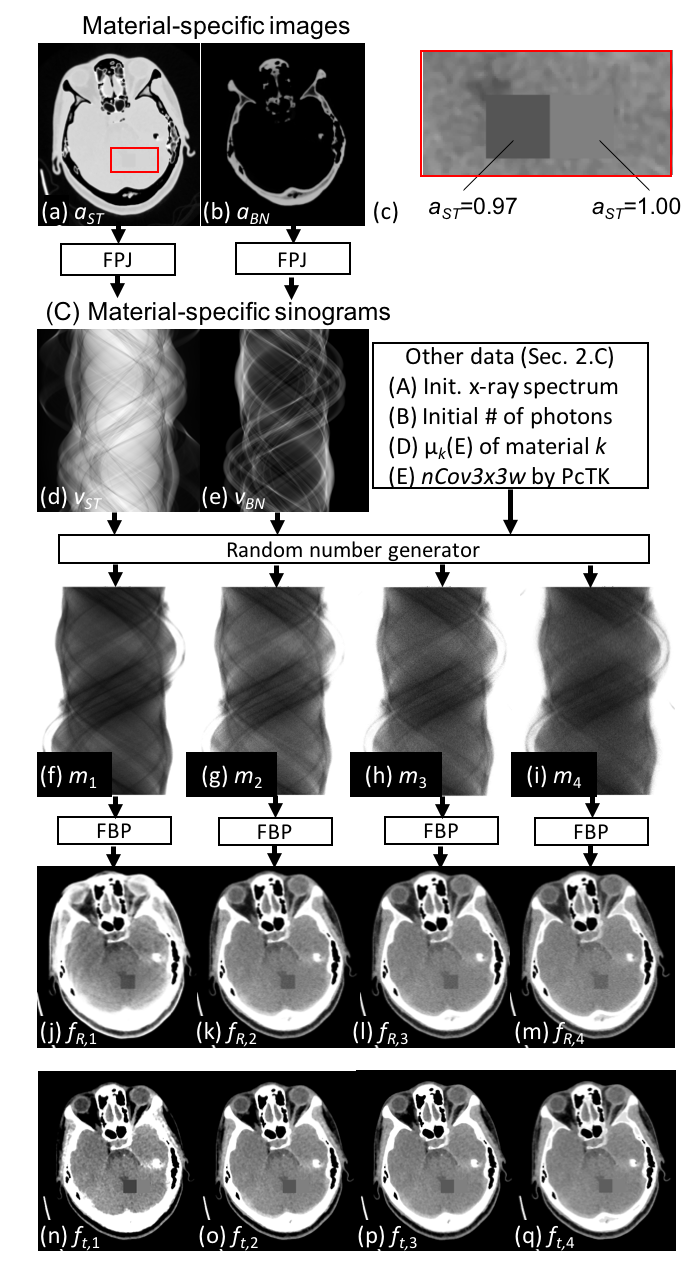
Using the workflow script, users can generate correlated noisy PCD data (Figs. 7f–7i) from “material-specific sinograms” (C in Fig. 7)) and other parameters (A–E in Fig. 7).
There is a caveat. Generating correlated noisy data that are correlated among neighboring pixels, allows for more realistic PCD simulation, but takes longer time (hours). We provide a script that generates uncorrelated noisy PCD data with the same expectation. Generating uncorrelated noisy data, where all of PCD data are independent to each other, allows for more efficient computation (minutes) at the expense of the lack of noise correlation. The bottle-neck of the scripts is the way to call a random number generator of Matlab—more specifically, a random number generator is called for each set of 3×3 neighboring PCD pixels. It would be great if users can offer suggestions on more efficient ways or GPU-based programming.
Ref. 1. Taguchi K, Stierstorfer K, Polster C, Lee O, and Kappler S. Spatio-energetic cross-talk in photon counting detectors: Numerical detector model (PcTK) and workflow for CT image quality assessment. Medical Physics. 2018;45(xx):xxx–xxx. (tentatively accepted). This paper outlines PcTK version 3.2.
Ref. 2. Taguchi K, Polster C, Lee O, Stierstorfer K, and Kappler S. Spatio-energetic cross-talk in photon counting detectors: Detector model and correlated Poisson data generator. Medical Physics. 2016;43(12):6386–6404. DOI:10.1118/1.4966699 This paper outlines PcTK version 2.1.